
What is it and why is it important?
Performance tuning is the activity undertaken to improve and enhance the throughput of a system. The throughput of a database system is measured by how fast it can process queries and deliver results. The faster a database can process queries lesser will be the latency and better will be the user experience. However, due to the huge size of databases and the huge load on them most databases develop lag over a period of time and the user experience becomes unpleasant and even untenable. That is why performance tuning is so vital and constitutes one of the main activities of database administration. It is an ongoing activity unlike database deployment or database design which is mostly a onetime activity.
What affects database performance?
Before being able to fine tune the performance of a database we have to know and understand the different factors which affect it. There are a number of factors which affect the performance of a database which are listed below.
- Installation and configuration–Sometimes database performance issues are the result of dimensioning and compatibility issues. It is very important that proper dimensioning with respect to hardware is done so that the physical or virtual server on which the database is deployed can support it. It is also very important that the operating system on which the database is installed is compatible and made up to date with the latest and required patches and releases. Another important reason for database performance issue is running the database with default or improper configuration. Like for example housing the data and log files on the same disk or partition. It is a problem because data files are accessed by the DBMS randomly and log files sequentially.
- Inefficient queries – This is the primary reason which is responsible for the maximum number of performance issues. Writing efficient SQL queries which execute in the least time consuming the least resource is an art.It requires in-depth knowledge of the query execution process and the order and manner in which different SQL clauses and parts of a SQL query are processed. One has to know where one should use a WHERE and where a JOIN would be more efficient. Some thumb rules are to avoid correlated subqueries, use BETWEEN instead of IN to search from a range of values, use NOCOUNT when performing INSERT, UPDATE, DELETE, SELECT operation, specify the column names to retrieve in a SELECT query instead of using the wild card *, use EXISTS/NOT EXISTS to check for the existence of a column value etc.
- Improper, missing and/or unnecessary indexes – To put it very simply an index is a sorted mini version of a table containing only those columns which are most frequently accessed. It is actually a means of improving performance but can become an issue if there are unused indexes in the database or indexes are not updated to concur with changes made to the tables in the database.
- Query processing – A very important factor and concept which affects SQL Server performance is query processing. Every query is a process and often queries are grouped together and processed as a batch. Multiple processes and batches run in the server at a time as a result of which many processes are in different wait states like SUSPENDED, RUNNABLE etc. Depending on why a query is waiting there are different wait types. A query might be waiting for disk read, disk write, table lock, CPU or because it is blocked by another query/process. Abnormal wait times can be caused by blocking queries, hardware bottleneck etc. and the same can be identified by the wait type and the process causing the wait. If it is a system process then the issue is outside of SQL. If it is a SQL query then the issue is with the query and such blocking queries are called root blockers.
Performing performance tuning of SQL Server
Performance tuning is both a proactive and reactive process. The proactive part consists of following good practices while deploying the DBMS, designing the database and monitoring the database on an ongoing basis. Some good practices which make database operations fast and secure include normalizing the database to the extent possible (ideally to the third normal form), using appropriate datatypes in tables, using Common Table Expressions (CTE’s) instead of TempDB, using stored procedures, using schemas, using cursors as sparingly as possible, using views for complex queries whose results are accessed frequently, using alias names for columns and tables in queries instead of referring using actual name, create appropriate indexes and write queries to prevent index and table scan etc.The reactive part consists of troubleshooting issues of overall slowness of the database or parts of it and the worst-case scenario of the database coming to a halt.
The process of performance tuning mostly involves identifying offending queries and then doing a root cause analysis on them. The same is done with the help of tools like the Activity Monitor, Query Store, Dynamic Management View (DMV), Query Optimizer (which generates query execution plan). Usually the issue is due to a software problem and can be fixed by re-indexing, modifying the query or the query execution plan. In rare cases it is due to a hardware bottleneck which can only be fixed by hardware augmentation. In such cases we can take the help of tools like the Performance Monitor or System Monitor to detect the exact piece of hardware causing the issue.
The tools mentioned above are inbuilt within Microsoft SQL Server and the Windows Server operating system. There are also free and commercial tools which are more specific to the purpose and used commonly by enterprises. We will however confine ourselves to the inbuilt toolsand discuss them briefly one by one. I will also mention some of the other popular tools at the end of the article for self-exploration.
1) Activity Monitor
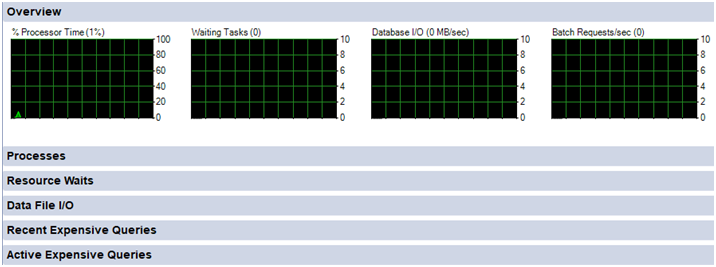
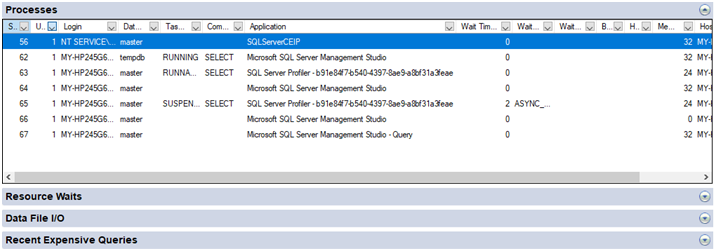
It is a feature available in SQL Server Management Studio (SSMS) and can be accessed by right clicking the server instance in the SSMS window. It shows a graphical overview at the top and sections below for processes, wait statistics, IO and expensive queries. Each of these sections contain detailed information. For example, the processes section shows the details about a process like user running the process, database on which a process is operating, the process state, wait time, wait type etc. It also has two important sections called Recent Expensive Queries and Active Expensive Queries which explicitly display information about resource hogging queries for analysis. The figures that follow are a representation – the first is the overview and the second shows the expanded processes section which lists the different running processes and the parameters associated with them.
2) Query Store
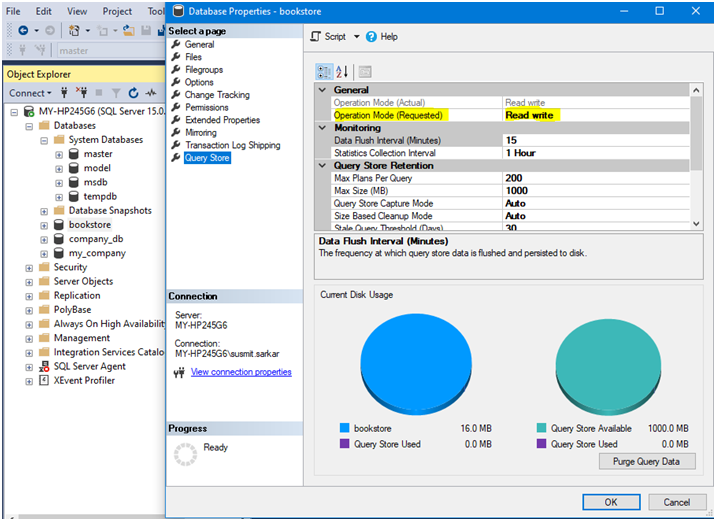
It is a feature which has to be enabled from the properties window of a database by selecting Read/Write for Operation Mode (Requested). Refer following figure which shows the Database Properties window for the bookstore database and the Operation Mode (Requested) parameter highlighted in yellow.
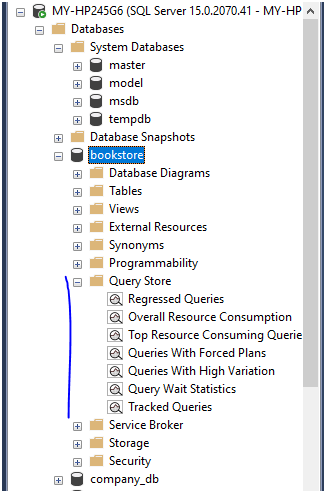
Once done a Query Store node is added to the database tree with sub trees of which the most important and useful for analysis and fine tuning are Top Resource Consuming Queries and Query Wait Statistics subtrees as can be seen in the following figure.
3) Dynamic Management View (DMV)
DMV’s were introduced from SQL Server 2005. There are different categories of DMV’s which generate read only views of different aspects of database activity. Like for example the sys.dm_exec_sessions returns information about the SQL Server sessions. SQL queries can be written around a DMV to obtain specific relevant information required for analysis. Below is an example of a query written with the sys.dm_exec_sessions DMV and following it is the result of the query from my system.
| SELECT login_name,COUNT(session_id) total_sessions FROM sys.dm_exec_sessions GROUP BY login_name; |
| login_name | session_count |
| MY-HP245G6\susmit.sarkar | 6 |
| NT SERVICE\SQLTELEMETRY | 1 |
| sa | 63 |
4) Query Execution Plan (QEP)
A query execution plan also called a query plan is the sequence of steps performed to access the data in a relational database. It is a cost-based plan generated by the Query Optimizer and stored in a cache called the plan cache. There are 2 types of plans – estimated plans and actual plans. Ideally both should be same and usually both are. But there can be discrepancy which might be an indication that the system is not using the right plan for query execution causing performance degradation.A very important aspect of QEP is to ensure that the right plan remains in the plan cache and is reused whenever the query is executed. QEP fine tuning involves generating and choosing the best plan and making it permanent in the system.
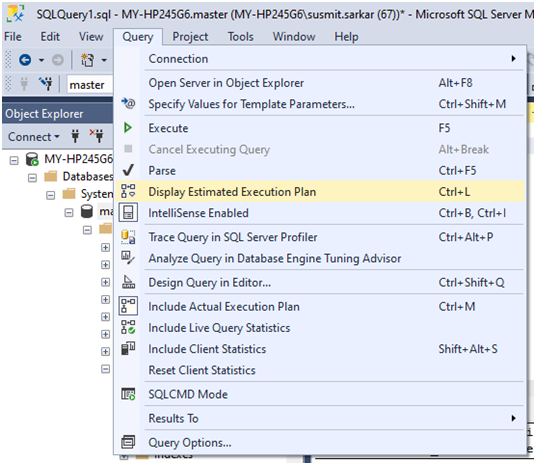
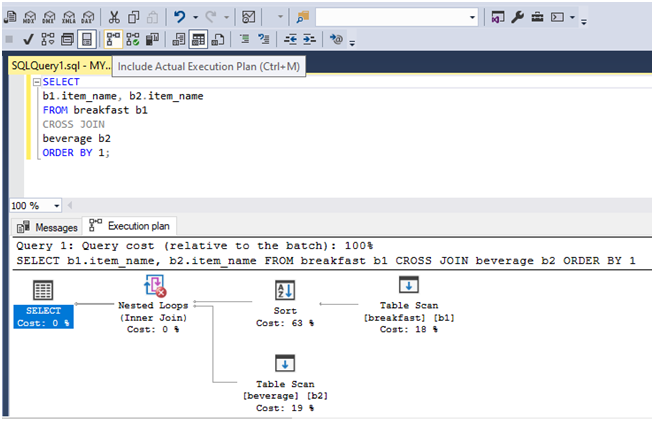
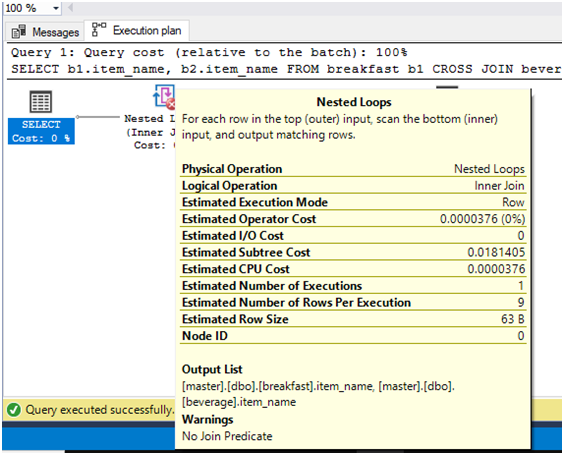
The QEP can be accessed and retrieved in graphical, text and XML format for analysis using the Activity Monitor (described above), DMV, SQL Server Profiler. It can be fine-tuned using the Database Engine Tuning Advisor. The simplest way to display the estimated query execution plan is by placing the query in the query window and pressing Ctrl + L. For actual execution plan press Ctrl + M. The figures below give an idea of how to go about the process. The first figure reveals the options available in the Query tab in the File menu. You can see the Display Estimated Execution Plan and Include Actual Execution Plan options. The second figure shows the estimated QEP for a query with the plan cost. The last figure shows the details of the activities involved for the second step.
5) Event Monitor and Performance Monitor
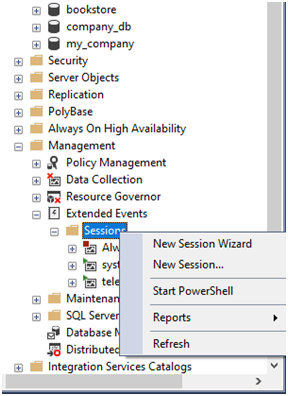
Event Monitor and Performance Monitor are two very basic but highly useful Windows Server tools which can be used to troubleshoot and fine tune SQL Server performance issues arising outside of SQL. Events from source MSSQLSERVER under Windows Logs -> Application represent SQL Server events. In addition, SSMS provides a feature called Extended Events. Extended Events allow an administrator to capture custom SQL Server events from a wide range of predefined events and they can be viewed and monitored from within SSMS without accessing the Event Viewer. The following figure shows how a new Extended Event session can be added by right clicking the Session subtree under the Management tree.
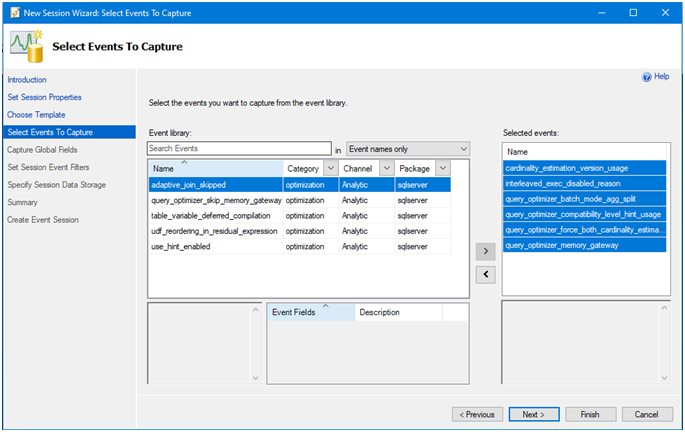
In the session creation wizard, we can select events of different categories and the they will show in the SSMS window. Refer the figure below which represent the Select Events tab of the wizard.
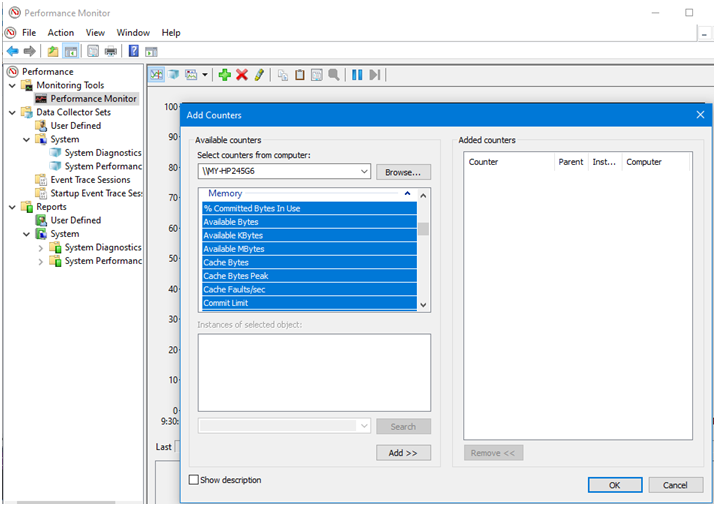
The Windows Performance Monitor tool allows us to add SQL Server specific counters for their continuous monitoring. There are about 15-20 important counters which can be added from any SQL Server in the network for proactive monitoring. Some of the most important among them are Memory\AvailableMBytes, Processor(_Total)\% Processor Time, Paging File(_Total)\% Usage, PhysicalDisk(_Total)\Avg. Disk sec/Read,PhysicalDisk(_Total)\Avg. Disk sec/Write, SQLServer:SQL Statistics\Batch Requests/sec, SQLServer:General Statistics\Processes blocked, SQLServer:SQL Statistics\SQL Compilations/sec, SQLServer:SQL Statistics\SQL Re-Compilations/sec. The following figure shows the counter add screen from Performance Monitor. The counter add screen is invoked by clicking the green plus icon at the top.
Conclusion
There is no vanilla approach or methodology to SQL Server Performance tuning. The approach and the tool or toolset used differ between organizations and database administrators. Some prefer one over the other. But ultimately it all boils down to narrowing down the possibilities and identifying the process or processes which might be a SQL query or SQL Server process affecting the system adversely and degrading its performance. To end I am mentioning the names of a few very popular non-Microsoft tools used for SQL Server performance tuning which includes SolarWinds Database Performance Analyzer (a continuous monitoring solution), ApexSQLPlan (to troubleshoot execution plan related issue), sp_BlitzFirst (collects all data from the SQL Server Agent i.e. MSSQLSEERVER windows service), sp_BlitzCache (identifies the worst performing queries) etc.